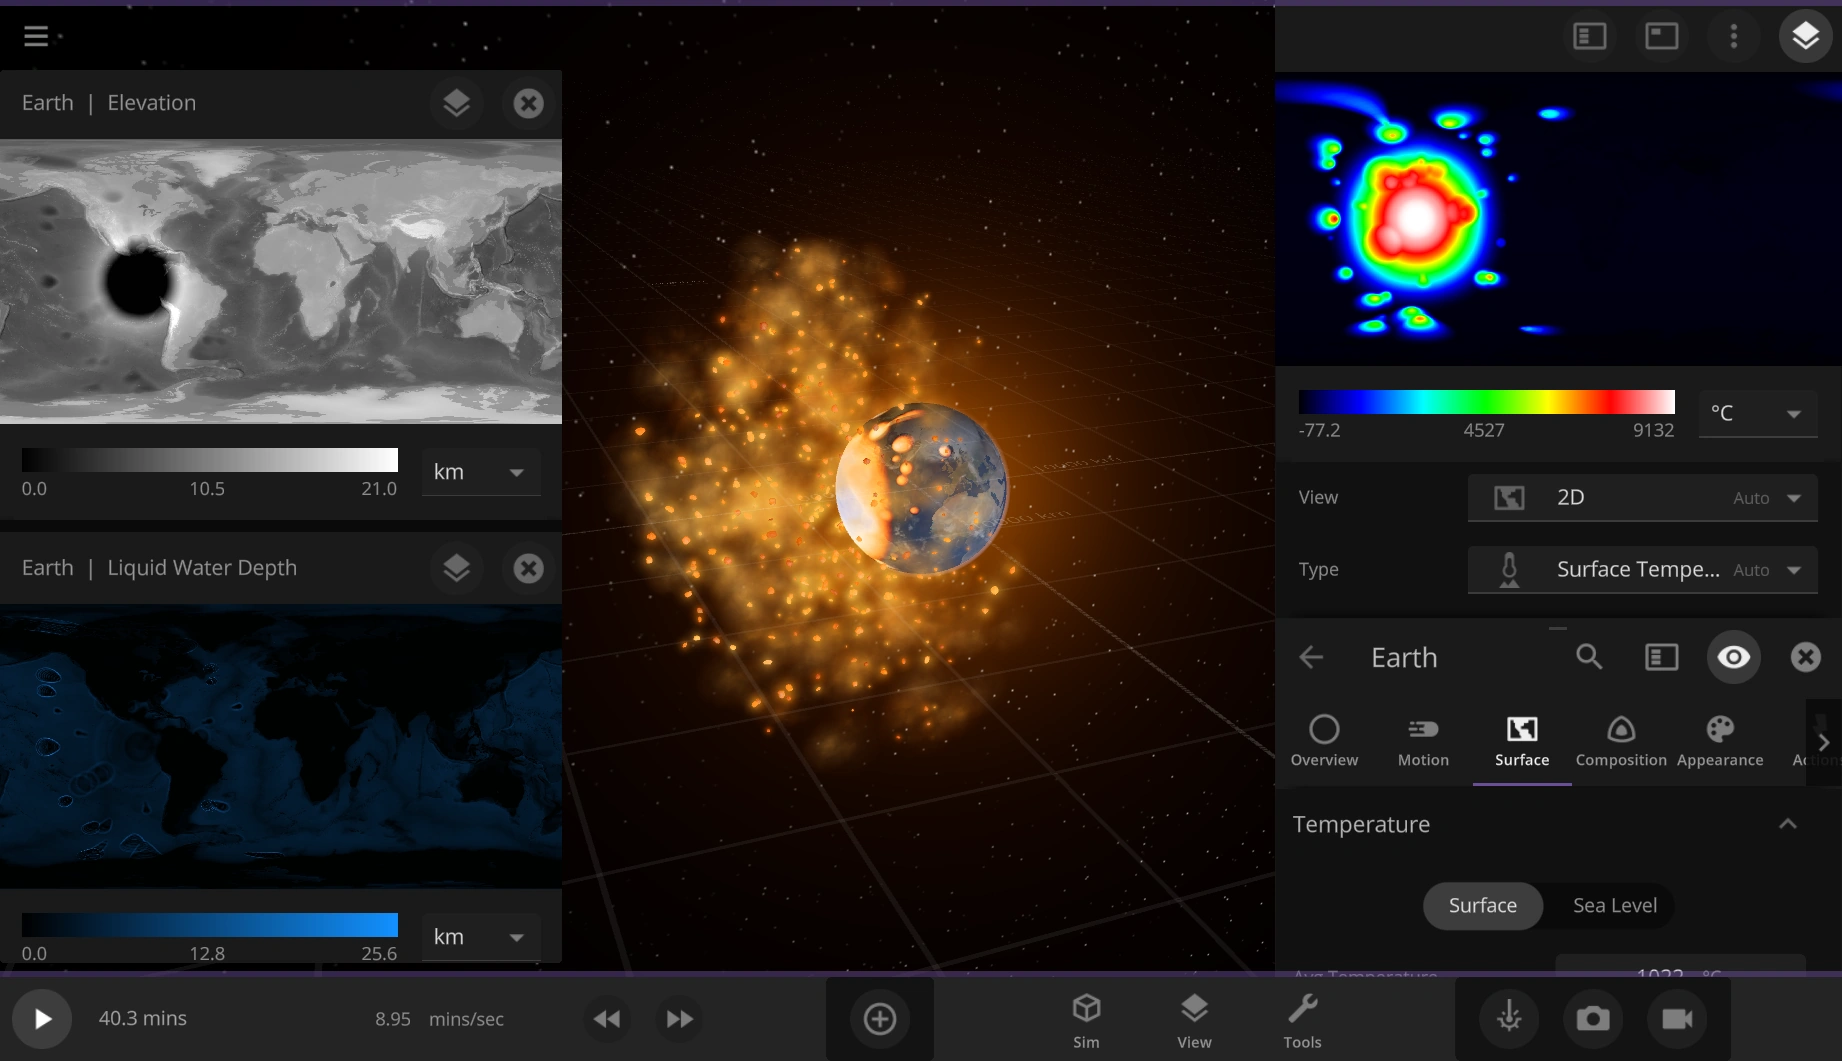
The Earth after being impacted by the Moon. Data maps display the Earth's Elevation and Liquid Water Depths on the left, and the Surface Temperature in the View Panel on the right.
Universe Sandbox simulates several surface properties of Planetary Body objects in two dimensions, to represent the variation in these properties across the surface of each object. The Surface view at the top of an object's View Panel can display a map representing any of these properties.
Related Properties & Settings
Properties
The following properties can be simulated:
- Surface Temperature represents the temperature at the surface elevation at each point on the map. Surface Temperature is displayed using the same units as Average Temperature.
- Sea Level Temperature represents the temperature at sea level at each point on the map. Sea Level Temperature is displayed using the same units as Average Temperature.
- Elevation represents the height of each point on the map. Elevation is displayed using the same units as Radius.
- Displacement represents the change in the height of each point of the map relative to the original elevation. Displacement is displayed using the same units as Radius.
- Water Vapor Pressure represents the pressure of water vapor in each point on the map. Water Vapor Pressure is displayed using the same units as Surface Pressure.
- Liquid Water Depth represents the height of the surface of the water above the sea floor in each point on the map. Water Depth is displayed using the same units as Radius.
- Ice Thickness represents the thickness of the ice (solid water) layer in each point on the map. Ice Thickness is displayed using the same units as Radius.
Settings
The surface map for each of these surface properties can be displayed by using the Type setting in the object's View Panel.
Models
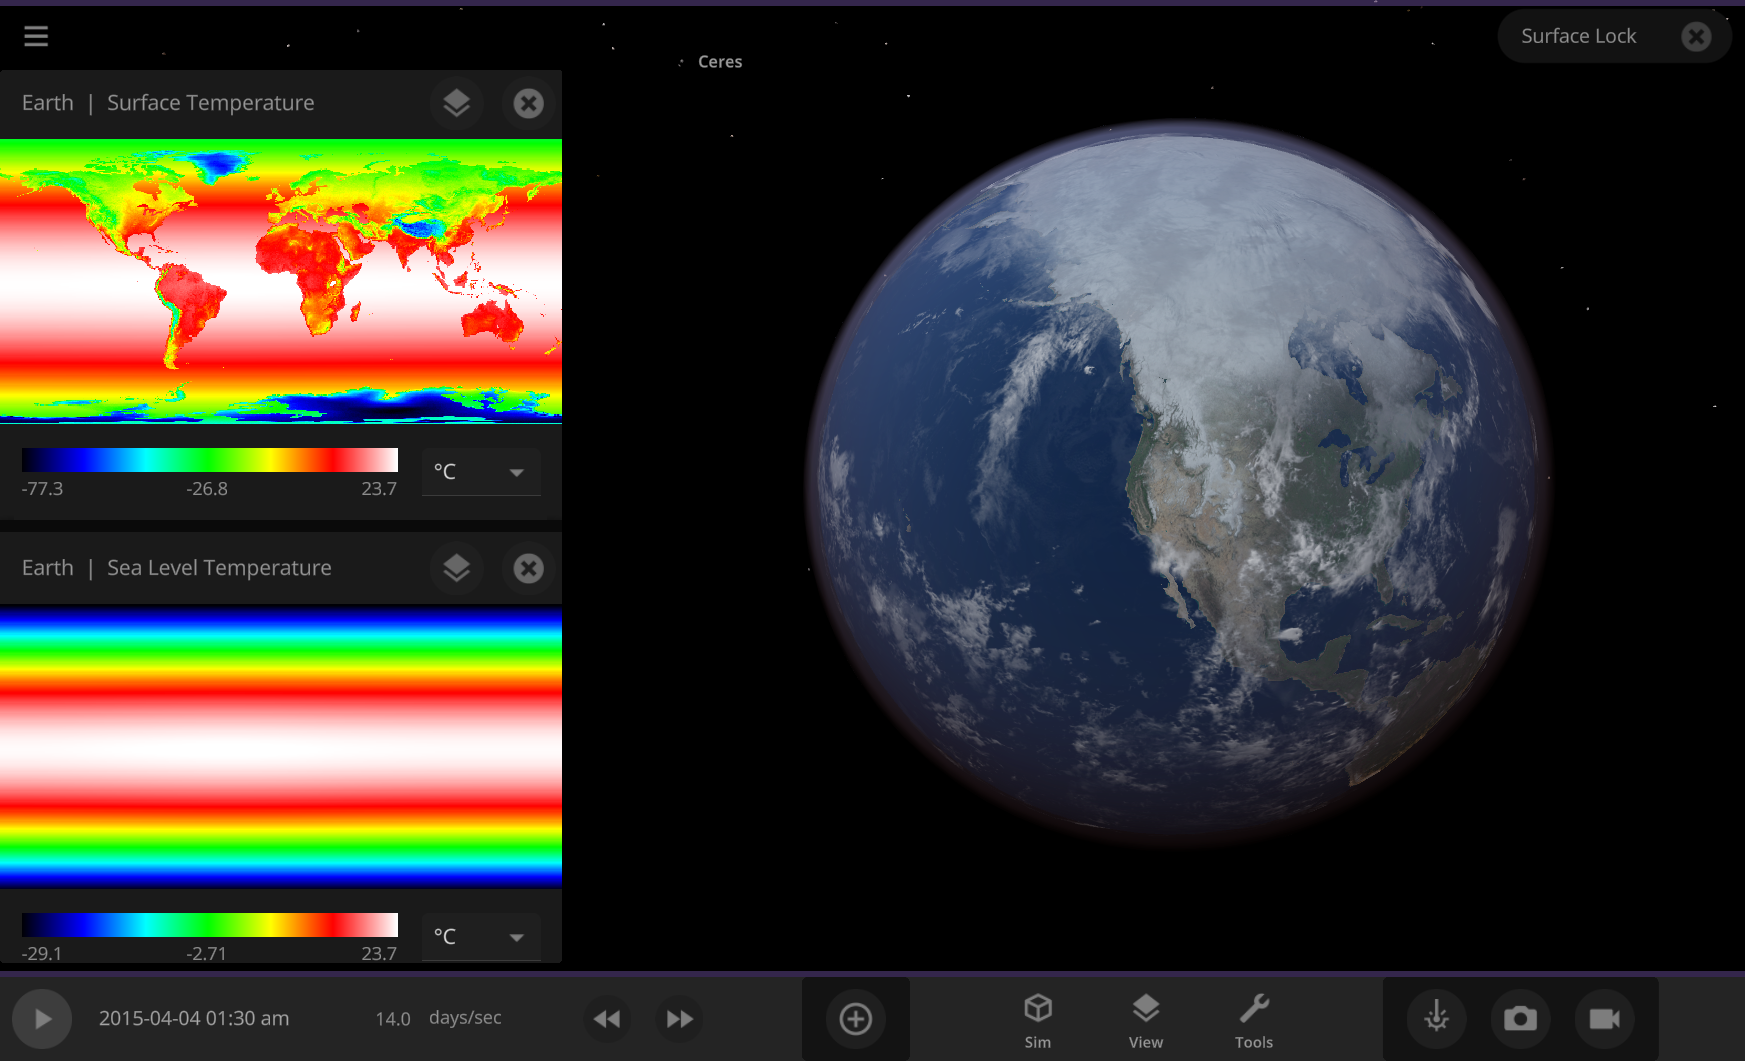
The Earth's Surface Temperature and Sea Level maps. Because the Surface Temperature depends on elevation, the continents are visible on this map. The Surface Temperature over the oceans, however, matches the Sea Level Temperature values.
Surface Temperature and Sea Level Temperature
The Surface and Sea Level Temperature layers represents the temperature of each point on the map of the object's surface. The temperature calculations consider the effects of incoming heat from sources like nearby stars, the effects of cooling, and the spread of heat across the surface of the object.
The difference between these two types of temperature is that the simulation of the Sea Level Temperature only considers the flow into and out of each point on the surface, and thus represents the temperature that would be measured at each point if it were at sea level.
The Surface Temperature, however, also depends on the elevation of each point above sea level. Surface points at higher elevations will be cooler, experiencing a drop in temperature with elevation that based on the object's Lapse Rate. Thus, the Surface Temperature represents the temperature that would actually be measured at the elevation above sea level of a given point.
In areas of the surface that are covered by liquid water, and thus have an elevation equal to sea level, the Surface Temperature will equal the Sea Level Temperature.
Elevation and Displacement
The Elevation and Displacement properties represent the height of every point on the surface map and the change in that height, respectively.
The Elevation map of certain known planets in the Solar System, including Mercury, Venus, Earth, and Mars, is stored in the Universe Sandbox database and based on actual data for these planets. The elevation maps of other objects, like exoplanets and randomly generated planets, are randomly generated.
The Displacement map of an object is empty at the beginning of a simulation. If the Elevation of the object's surface is changed, the Displacement map shows how much each grid cell has been changed from its original elevation. A positive value on the Displacement map indicates that the Elevation value of that cell has decreased, and a negative value indicates that the Elevation value of that cell has increased.
The Elevation map of an object can currently be changed via impacts, which will create craters that will decrease the elevation in some areas of the surface, and material is excavated, and increase the elevation in other areas, as debris is deposited on the surface.
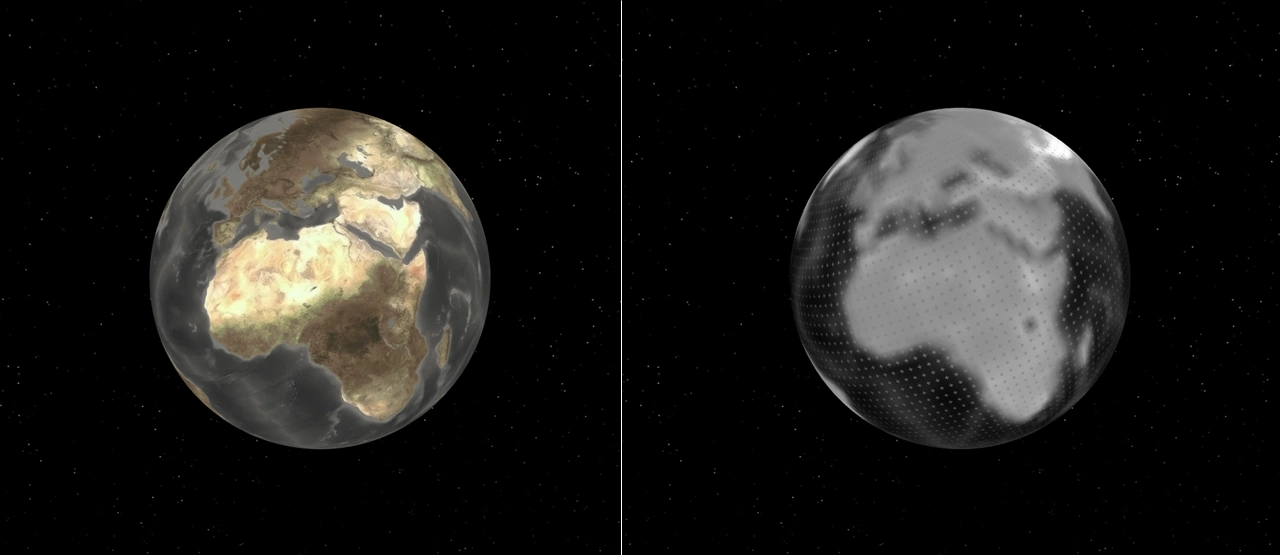
Left: The Earth with no water, seen with the default Universe Sandbox view. Right: The Elevation map drawn on the Earth's surface.
Material Phases
Universe Sandbox tracks three phases of water across the surface of the object. At every time step, at every point on the surface map, Universe Sandbox calculates how much of water will exist as a solid, liquid, or gas. The temperatures at which water changes between these phases (e.g., the Boiling Point or Freezing Point) depend on several properties of the object, including its Surface Pressure.
The amount of water that exists as a solid at a given point on the surface is represented by the Ice Thickness, the amount of liquid by the Liquid Water Depth, and the amount of gas by the Water Vapor Pressure. Water in the liquid or gas state can also move across the surface (see below).
Vapor Flow
The movement of water vapor across the surface of the object is simulated with a method similar to the one used to simulate heat diffusion. Vapor flows from areas of high pressure to areas of low pressure, so the vapor in a single point on the surface map of an object may spread or diffuse into nearby points, and the vapor in those points may spread to the first point. Universe Sandbox calculates this diffusion by using the FTCS method.
The water vapor pressure of each point on the surface map due to the water vapor present in that point is then updated based on the results of this diffusion calculation.
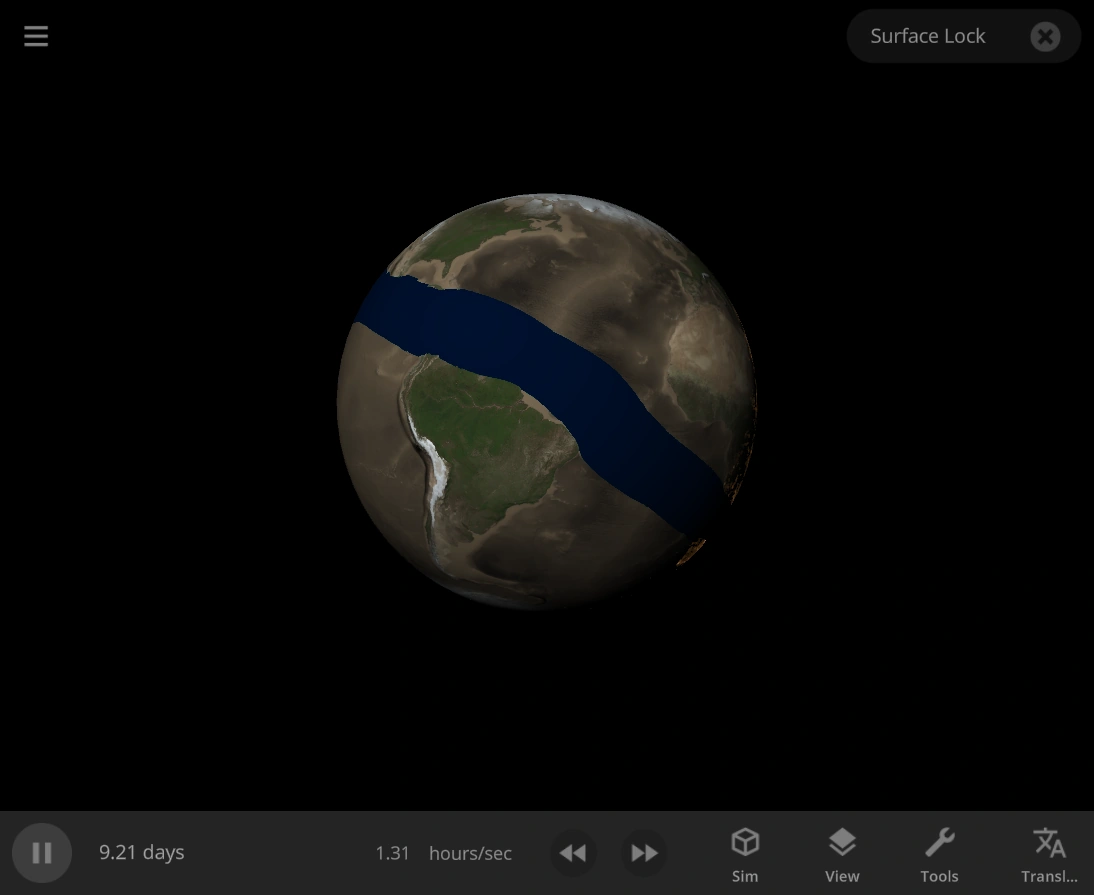
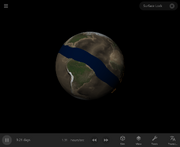
In this screenshot from Update 30, the Earth's rotation speed is fast enough that all the surface water has been pushed into a band at the equator.
Liquid Flow
The movement of liquid water across the surface of the object is simulated with a method similar to the one used to simulate heat diffusion and vapor flow. The rate at which liquid flows in each direction is determined by the difference in elevation in nearby regions, as well as the Surface Gravity of the object. [1]The centrifugal force of a spinning object will also push water away from the poles of the object's Rotation Axis.
Snow
Universe Sandbox includes a graphical representation of snow that will be present on mountain peaks above a certain elevation if water is present. The snow is not fully simulated, like ice and liquid water are, but as of Update 27 it is allowed to accumulate and melt over time, rather than instantly changing.
Snow accumulates at a rate of one inch per hour on any area of the surface whose Surface Temperature is lower than the Freezing Point of water and whose Water Vapor Pressure is greater than 50 Pascals. It will melt at the same rate if the Surface Temperature is higher than the Freezing Point. Snow will then be displayed above a certain elevation in the high-resolution heightmap of the object's surface, based on the temperature and lapse rate at that point.